Once it all began with the simple need of organizing files. Why we are in 2014, but still have no convenient and easy to use tree editor at least? There are lots of text editors and new ones keep appearing nevertheless. Table editors are in a less quantity but struggle in quality only when coping with thousands of items.
Though, there are not too much general types of information visualization: String, List, Table, Graph, Diagram, Map, 3d, Network. It’s clear, there are much more subtypes, but the most popular types amount to decade. By nature these types can be classified by number of characteristics visualized at once.
One-dimension: list, timeline, etc
2d: table, map, graph, histogram, etc
3d: irregular sophisticated scientific visualizations
Multidimensional: trees, graphs, networks
Visualizations are created already in plenty and are kept going. There exist about three 3 hundred tree vis. modifications: treevis.net. Editors on the other hand are developed only for the most popular ones and none of them for trees or multidimensional vis. Meantime, first popular tree vis had been created in the days of console even before classic graphical interface appeared.
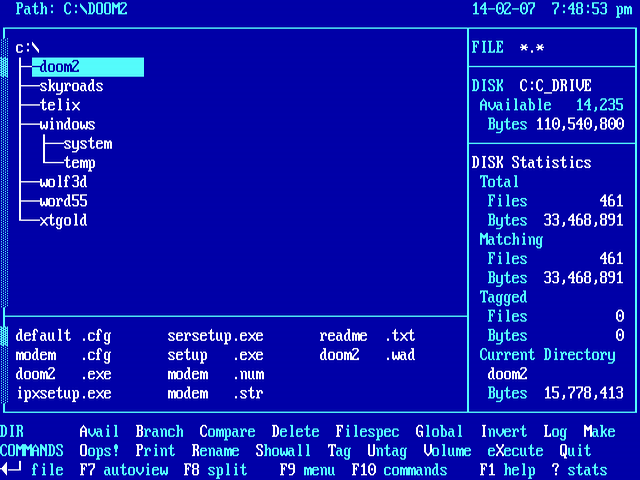 Jeffery C. Johnson, Xtree developer, created first working visualization in the late 1985. Files manager showed the hierarchy of folders tree. Window’s file manager, basically has the same functionality now: to Create, Rename, Move, Remove
Here is another example – Chrome bookmarks manager: 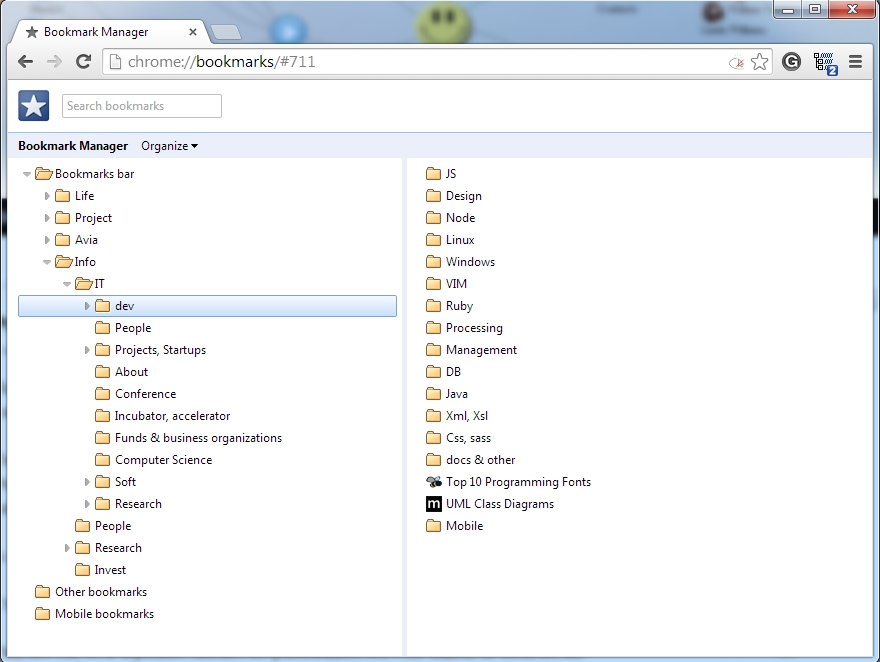 The same again, but starting from 2000 nodes it slows down the browsing 🙁
For the sake of web-applications there are fairly of widgets created. Almost every strong UI library comprises tree widgets Webix, Kendo-UI , and there is something more than just expand/collapse, like TreeGrid, embedded actions inside the table in ExtJS. But even basic data editing functionality should have sorting and filtering.
Sure, it would be perfect to have everything from this list:
| Create | |
| Edit | |
| View | |
| Delete | |
| Link | associate items with one another |
| Convert | change items type of visualization |
| Sort | reorder set |
| Filter | decrease subset |
| Zoom | increase/decrease item’s size |
| Group | Sort by Tag |
| History | Link with previous version |
| Sync | Link with other device |
| Copy | Create + Link |
| Merge | Link two similar |
| Send | Copy & Link with person |
| Rate | Link with quantifier |
| Share | Link with Person |
| Tag | Link with keyword |
Basic operations are painted in red.
Why is there still no tool for multidimensional data editing? Indeed, practically all information can be presented as linked nodes.
Here is the list of basic item types I use:
| Object | Origin by nature |
| Text | Sequence of signs |
| Image | Table of bits |
| Video | Sequence of images |
| Audio | Sequence of sounds |
| Date | Link |
| Location | Link |
| Icon | Image |
| File | Image, Text |
| Table | Layout |
| Tree | Layout |
| Graph | Layout |
| Web page | Layout |
| Bookmark | Link, Text |
| Tag | Text |
| Comment | Text |
| Playlist | Layout |
| Annotation | Text |
| Reminder | Date |
| Miniature | Image |
| Map | Image |
| Address | Text |
| Anything | |
| Post | Anything |
| Tweet | Anything |
| Photo | Image |
| Drawing | Image |
| Goods | Link |
| Message | Text |
| Note | Text |
| Event | Text, Date |
| Task | Text, Date |
| Recommendation | Text, Link |
| Contact | Text, Photo |
| Graphs | Image |
| Diagram | Image |
| Chart | Image |
| Commit | Text, Person |
| Document | Layout |
| Book | Layout |
And all of them are tightly coupled with each other. Existing services enables you to cope with only several of them giving you only couple of functions from the list above. Classic startups often look like minimalistic: “We offer new solution for the function X to operate with data Y” whether it is files synchronization, photo sharing or contacts manager. But some data consists of assemblies of connections by nature, like: tag cloud, map of traffic, website or project plan.
Perhaps, structuring of information is not an easy task and people try to simplify this by writing everything down to one text document, emphasizing parts with paragraph, color or bold font. But it was a luxury before MS Word.
It should be a tool for editing connections as intuitively and easy as we do this with thoughts in our mind.
MindManagers.
This is entire the separate class of applications, giving the ability to visualize nodes connections.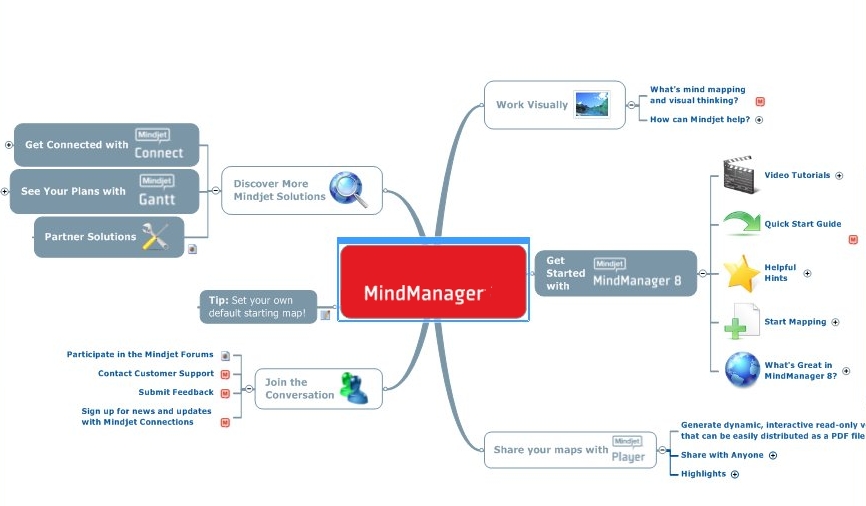 But almost all of them offer you only basic functionality for creating visualization. Create – Look – Forget. Nice picture to step aside and have a look on big picture, but nothing more. Only some of them, like “Mindmeister” provides something more. It has collaborative map creation. Of course there are professional tools, designed for specific data types and relations, like: phylogenetic_tree_visualization_software. But nothing else.
What about general purpose editor for structured data? As for the text, tables. Images, animations, event vector drawings have its editors and format standards? already. Good step forward was made recently by a company developing graph database – Neo4j. Ok, now we are able to store relations!
But we have two futher problems more. Mind managers are too static and we can’t see information behind visible nodes. Another problem is that a tree is only the particular case of a graph. Our brain consist of a heavily interconnected neuron network. That said every link has their own weight.? Recollections are stored in our memory as patterns, consisting of associations. Thinking is the journey through them.
While “Evernote” is successfully claiming itself as a tool for memory extension, it only enables you to note and store information.
What about application which will literally allow you to extend memory naturally associating your thoughts with your notes, contacts, files, etc?