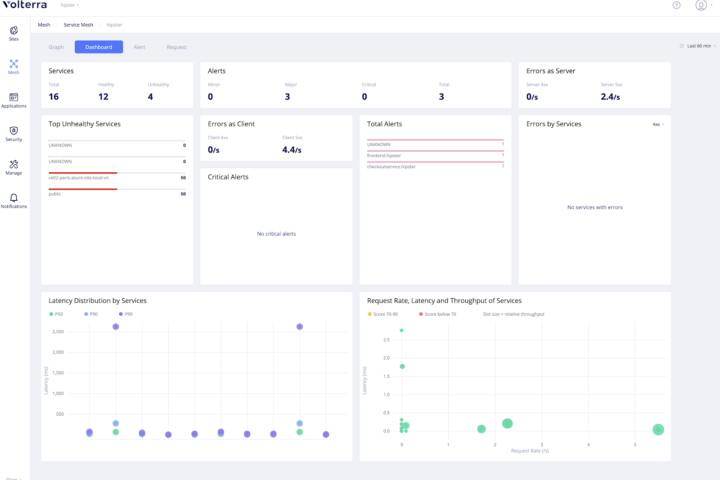
Provides a comprehensive overview of network infrastructure. Dynamically maps out the topography of physical servers, routers, virtual machines.
Real-time data on critical metrics such as load, status, and throughput for each device enables administrators to quickly assess the health and performance of the entire system at a glance.
The visualization is highly customizable, allowing users to zoom in on specific areas of interest, filter devices based on various parameters, and adjust the layout for optimal readability. The software also supports interactive exploration, enabling users to click on individual devices to access more detailed information or drill down into specific subsystems.
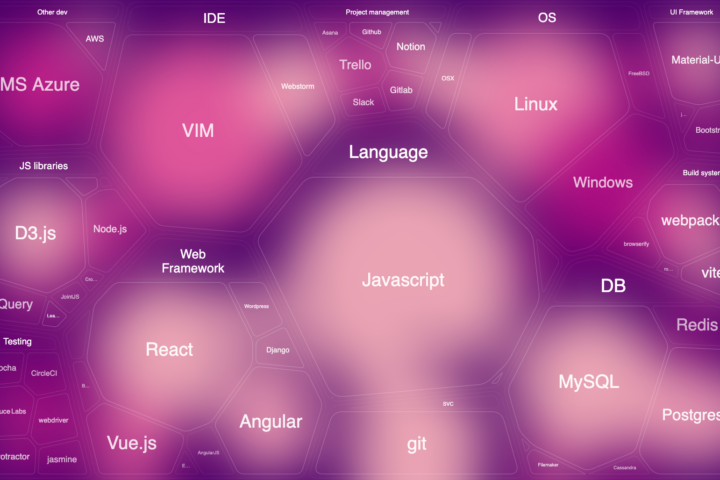
Each node has parameters to show or filter by: history of traffic data, cpu load, memory usage and many more. Some nodes represent groups, like a dedicated server might have multiple VMs.
The software can handle large-scale networks with thousands of devices while maintaining smooth performance.
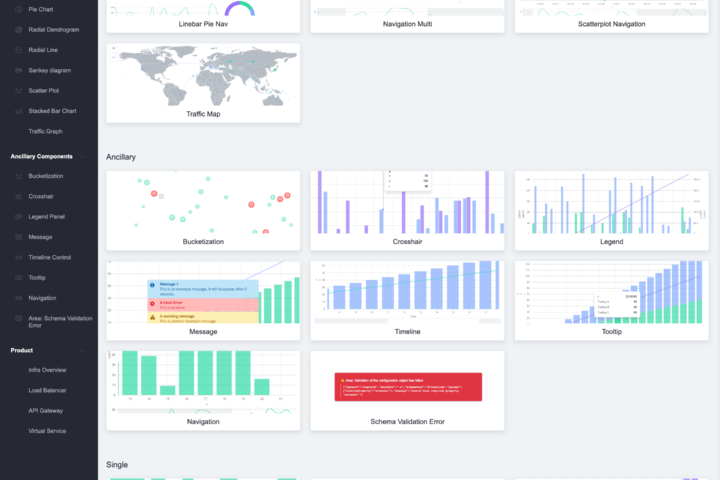
Key features:
- Graph layout is automatic with collision avoidance and different types of routing: rectangular, manhattan
- Layout can be manually adjusted with canvas pan, node move
- Nodes types are configuration based, so new data may be fed with associated presentation definition
- Nodes with children can be expanded and collapsed (shown as a group) with a different layout within a group: linear bus
- Selection of a node or edge opens a sidebar with additional info
- There is a filter menu by which nodes and edges can be shown or hidden based on selected parameters
- Node edges might also be of different types (visual differentiation by colour and line style
- Edges show realtime throughput by speed of dashed line move animation (useful to distinguish in orders of magnitude)
- There is a “Flow monitoring” mode which shows node live data charts along the nodes