• Client
    Volterra Inc.
  • Duration

    ~ half a year

  • Categories
    data visualization
  • Technologies

    d3.js, dagre layout, topojson, rollup, GitLab

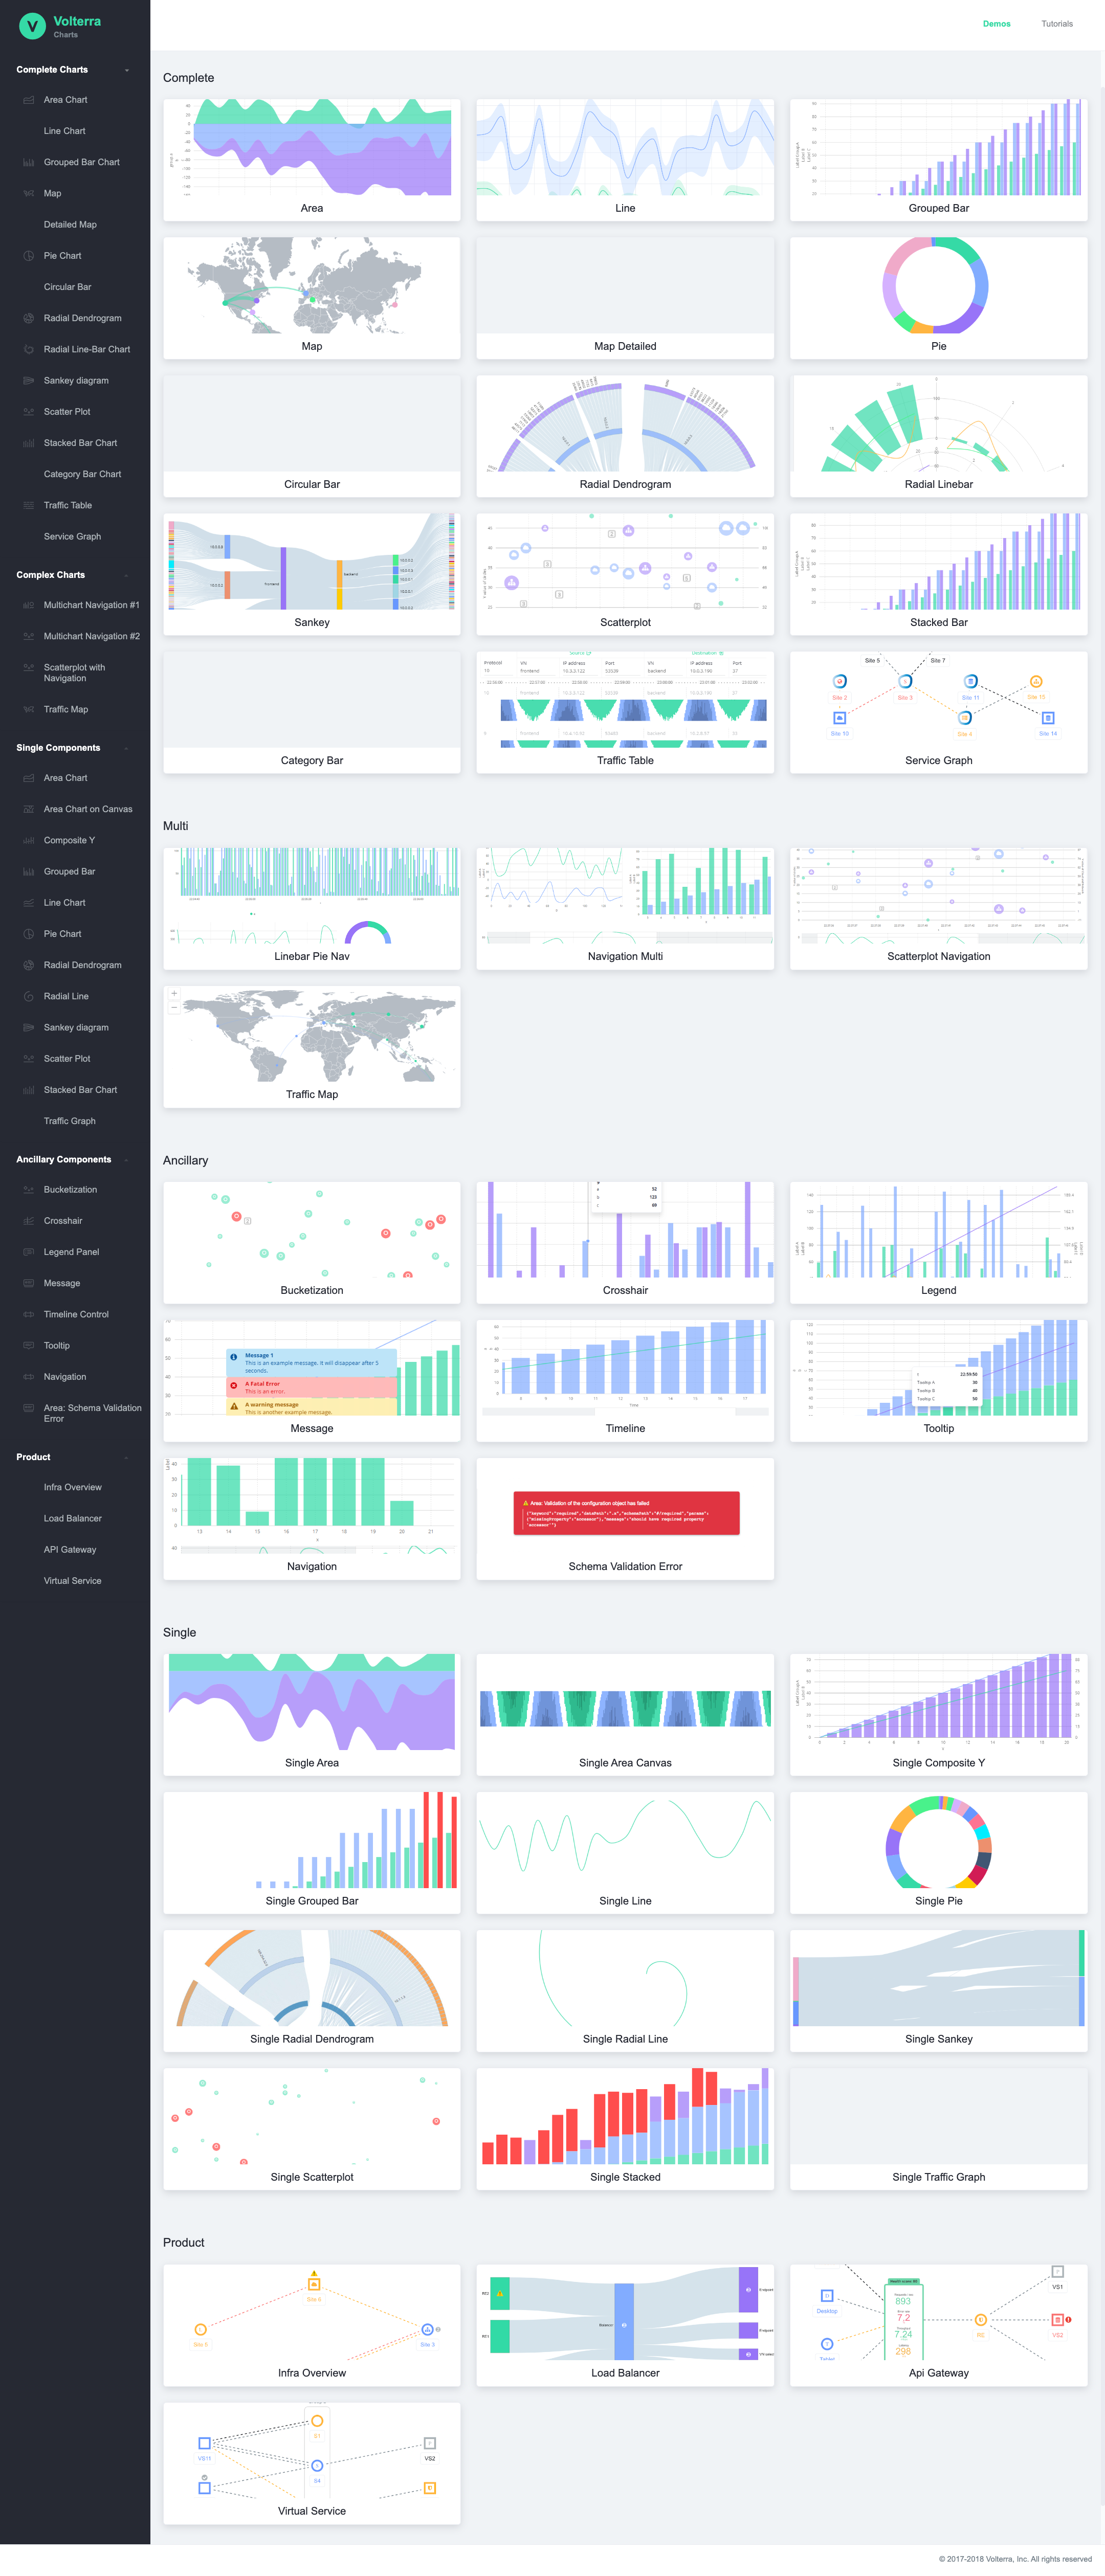
Building on top of the previous success – Contrail Charts library.

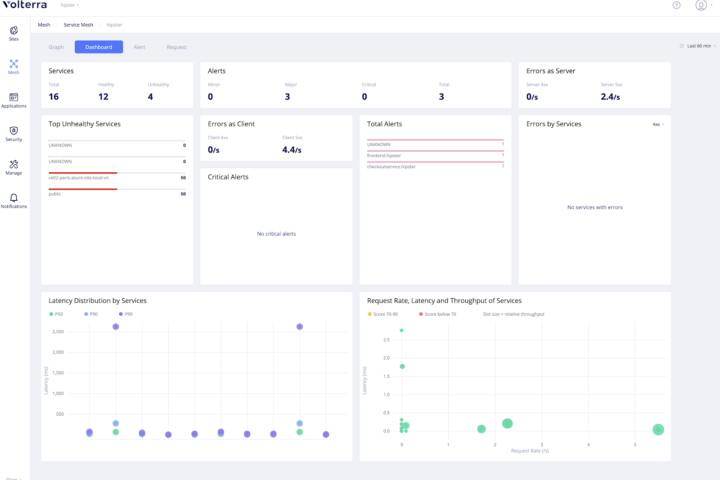
This is a refined and fine tuned version for Volterra networking data analytics platform.

Main design objectives:

  • more charts and more granular configurability
  • improved design
  • realtime data aggregation and render
  • light and dark themes
  • color schemes selection
  • configuration panel
  • json configuration code editor

P.S. This project continued after I handed it over to client’s inhouse team. 5 years later Volterra, as a part of F5 Networks, released next version of charts library. This time in typescript: Unovis. So happy to see the work in production and evolving!

See also

web-app data visualization
Cloud Services Monitoring

Volterra.io, now acquired by F5 Networks, S&P 500 member is a platform for distributed cloud services, where user can deploy, connect and operate applications.

web-app open source data visualization
City Weather Comparison

A beautiful weather visualization app lets you compare how it feels in different places around the world throughout the year

graphs data visualization
Realtime Network Analytics

Graph visualization provides a comprehensive overview of network infrastructure topography.