General purpose open-source charts library tailored for networking industry.
With a config-first design approach it offers broad customization.
Live Demo
All charts are implemented as individual components which may be combined into a composite chart.
Base components
Can be used standalone and in combination with each other
- Area chart
- Grouped bar chart
- Stacked bar chart
- Line chart
- Map
- Pie
- Radial bar chart
- Radial line chart
- Sankey
- Scatterplot
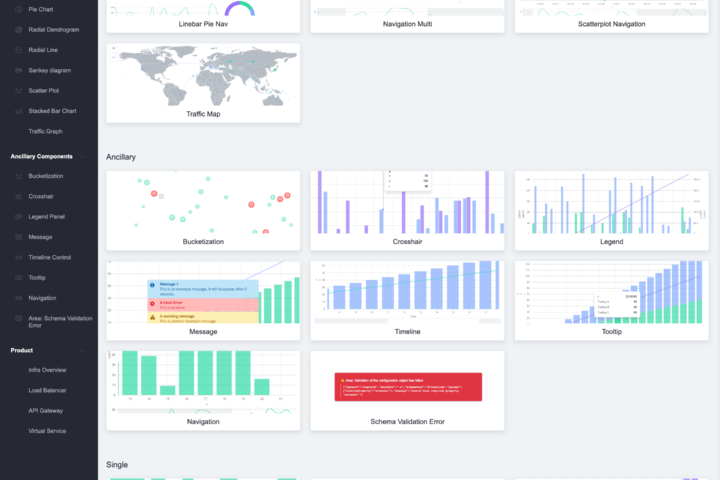
Auxiliary components
Complement base components with additional functionality
- Axis
- Brush – navigation selector
- Bucket – group of points in scatterplot
- Color picker – for legend panel
- Control panel
- Crosshair
- Filter panel
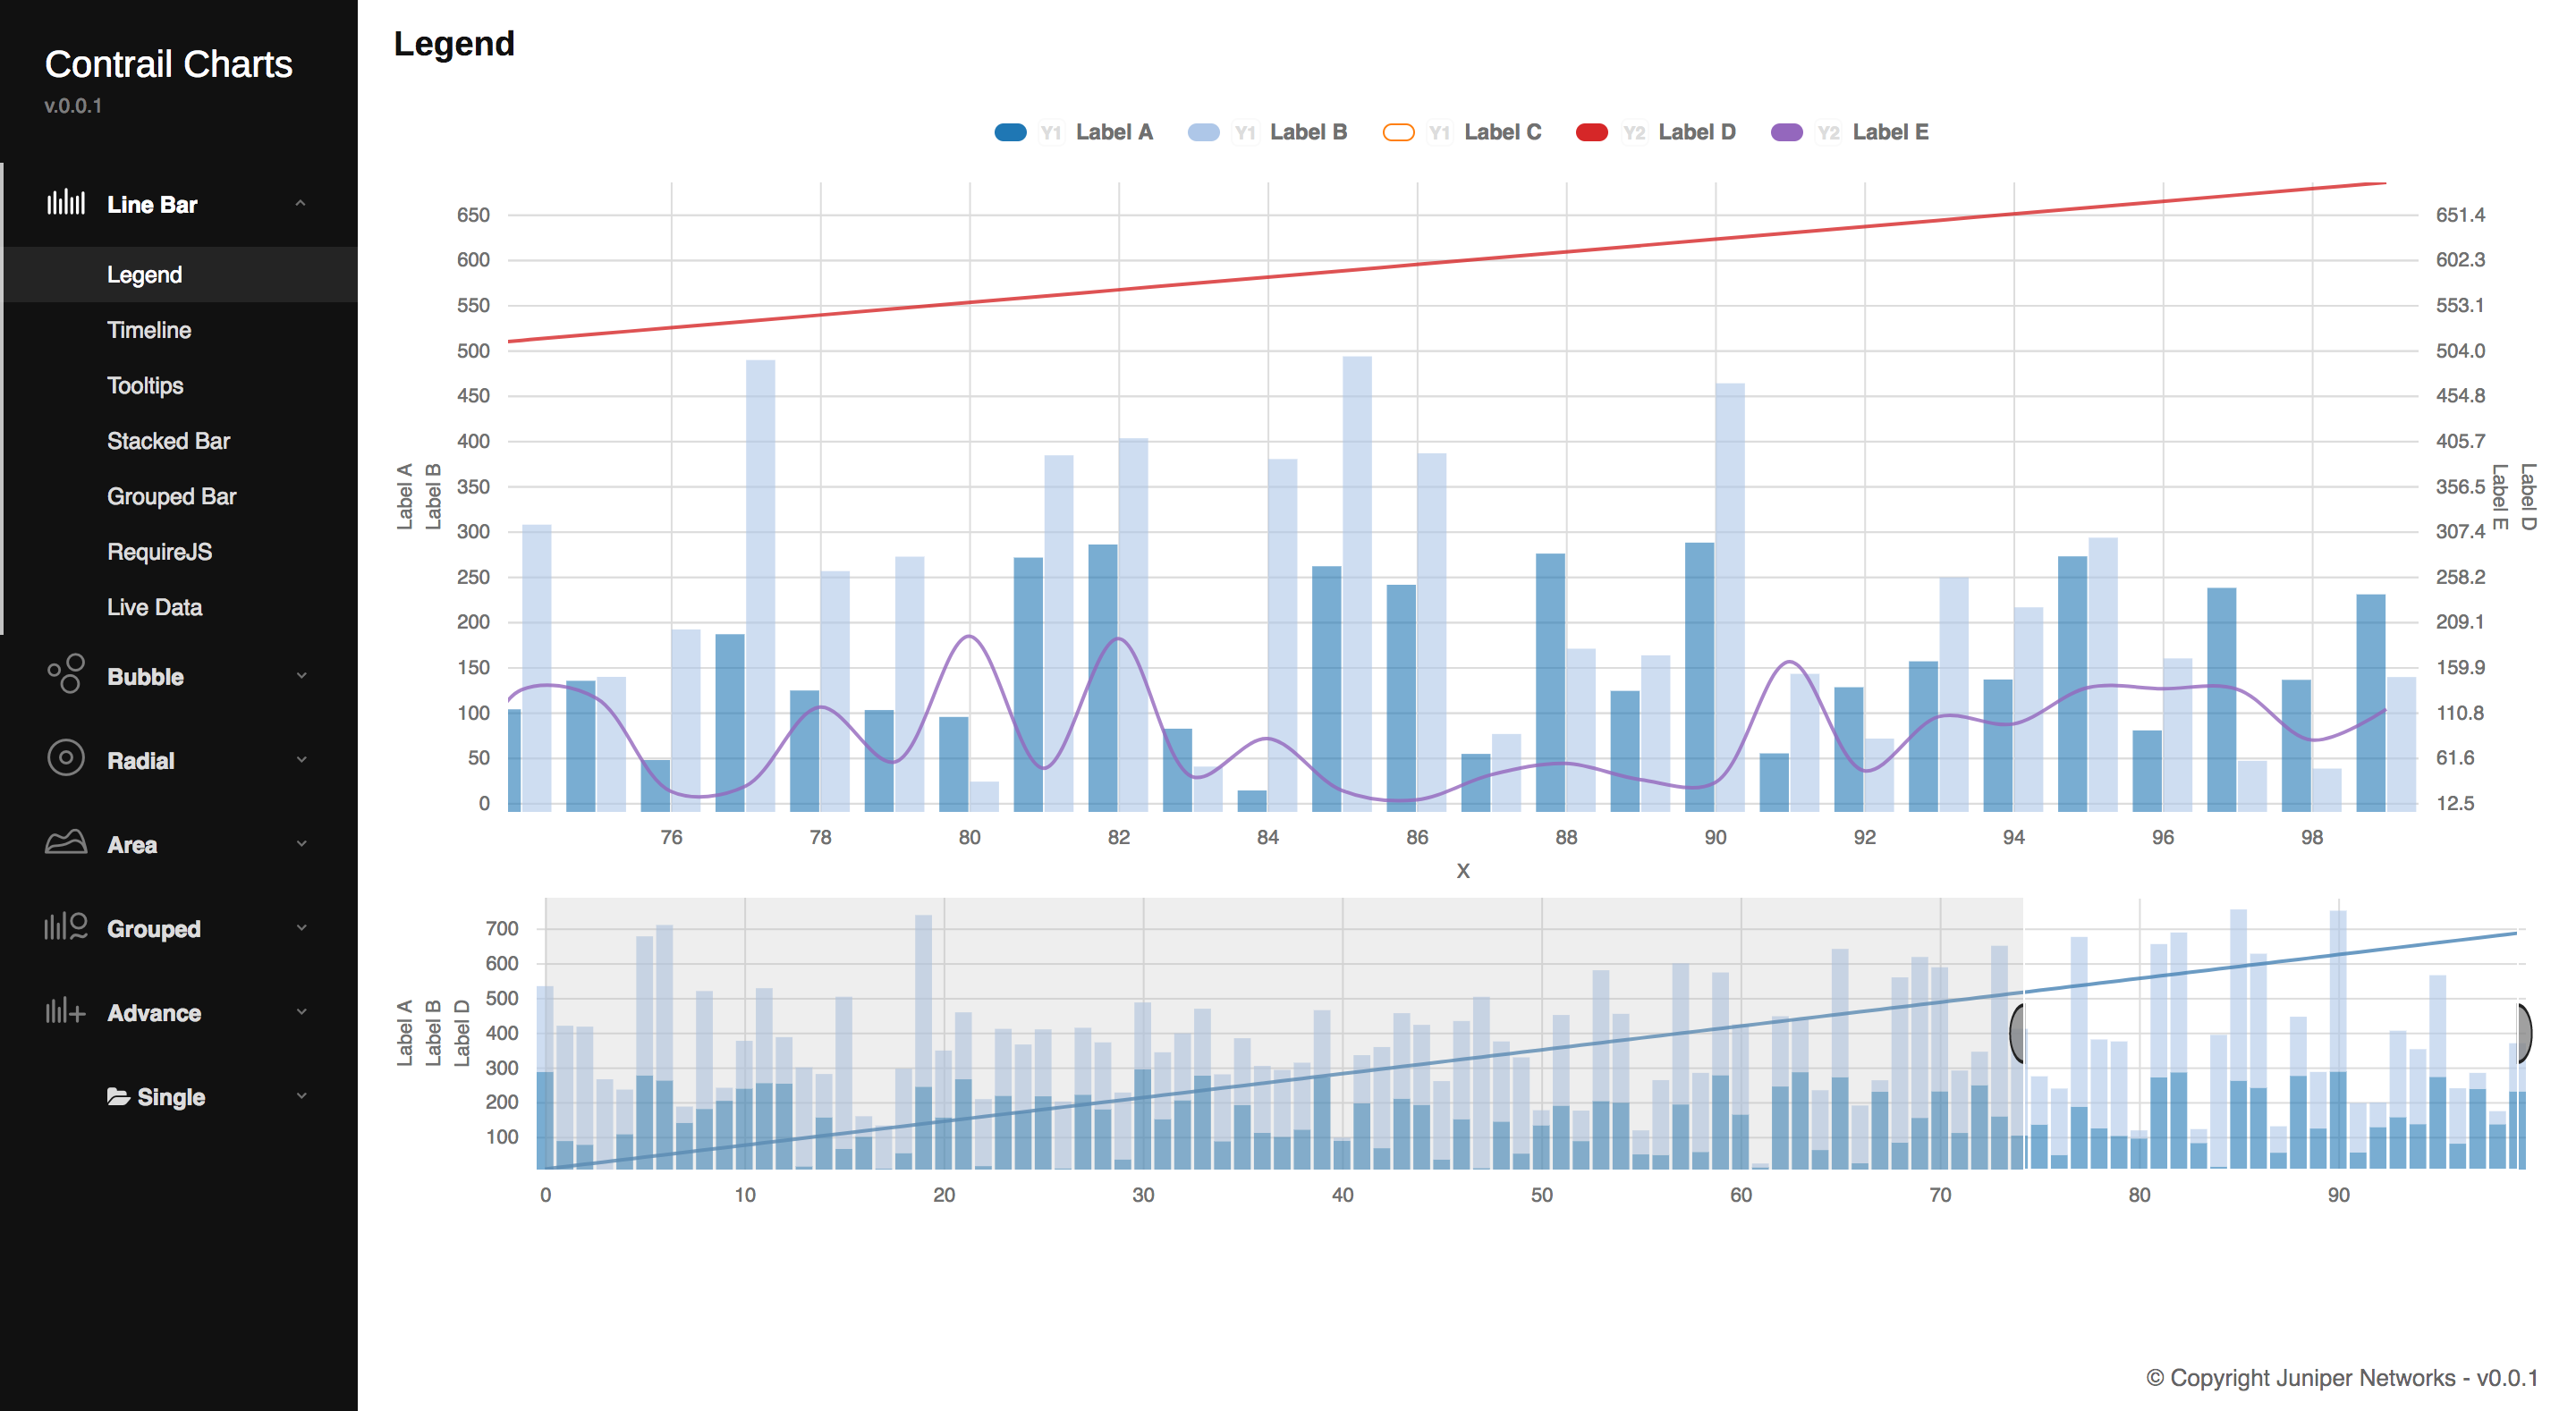
- Legend panel
- Message – for overlay messages
- Radial axis
- Timeline
- Tooltip
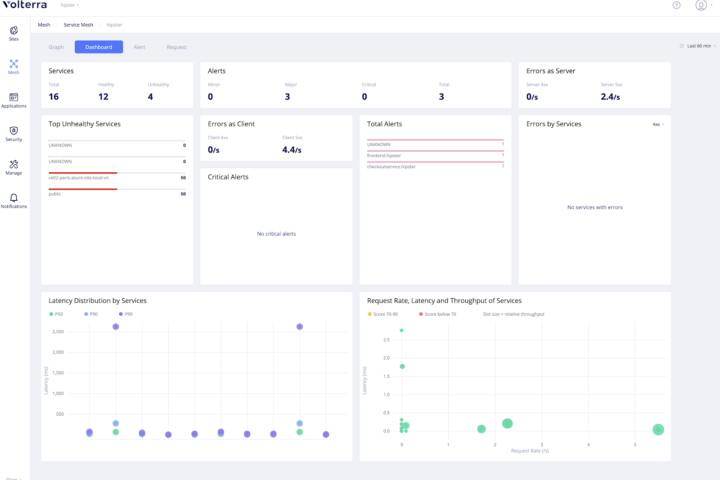
Composite components
Ready to be utilized as full-fledged charts
- CompositeY – to combine multiple types of chart on a single one, like lines and bars along with axes, etc
- Radial composite
- Navigation
Components may be set to communicate between each other to stay in sync, like when one chart may be used as navigation selector with a brush for the other.
All components follow single css theme by which you can set a common colorset or chart-specific params. Uses SVG and D3 library under the hood.