• Source code
    Github
  • Duration

    1 week

  • Categories
    open source data visualization
  • Technologies

    d3.js, webpack

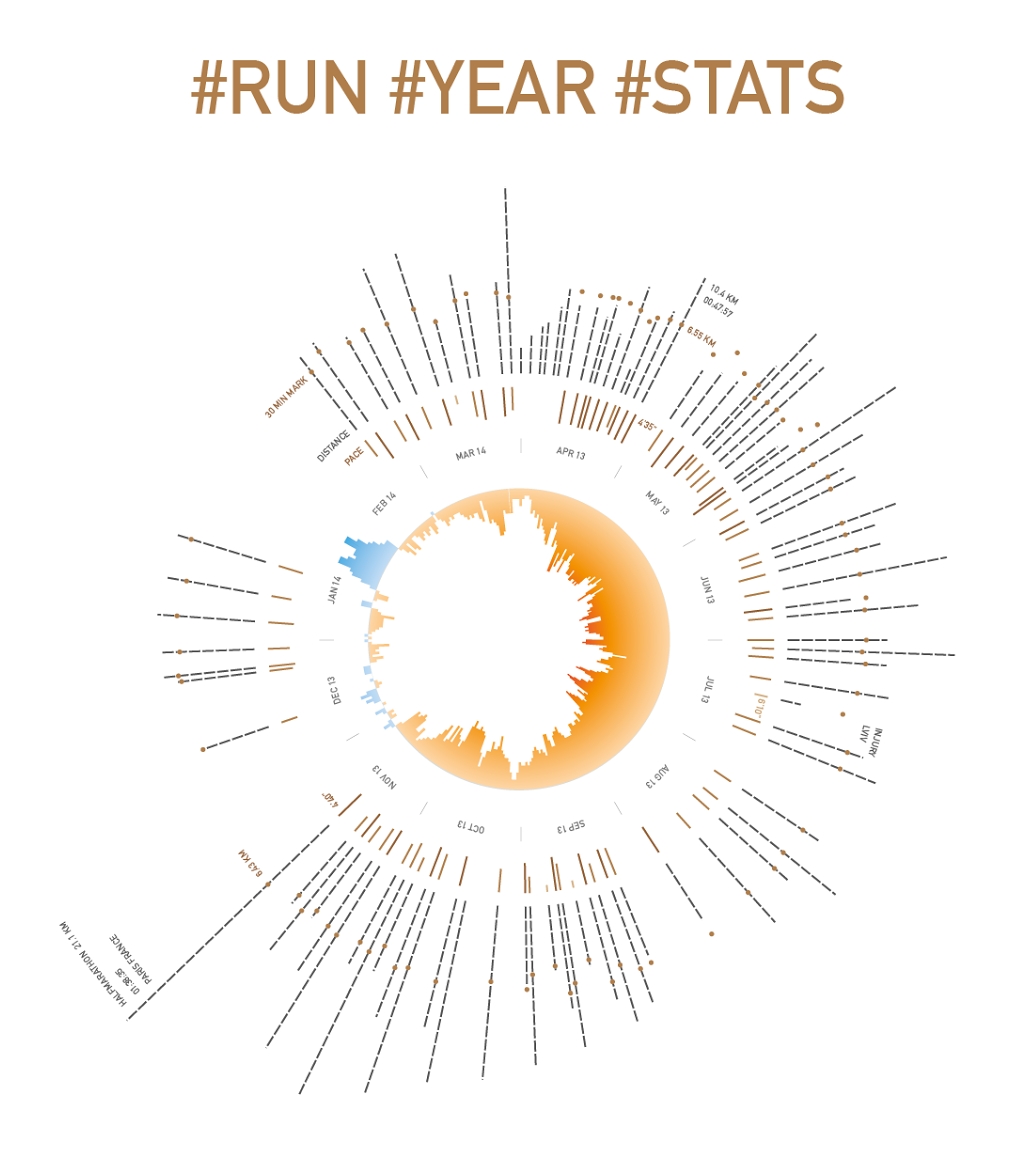
Statistics for a year of preparation to a marathon run

Live Demo

Hover over the bars to see the values for particular date in the center.

As this is open source, feel free to make use of it for your radial visualizations.

Design and run by Valera Vasylenko.

See also

web-app data visualization
Cloud Services Monitoring

Volterra.io, now acquired by F5 Networks, S&P 500 member is a platform for distributed cloud services, where user can deploy, connect and operate applications.

data visualization
Charts Library V2

Building on top of the previous success – Contrail Charts library. This is a refined and fine tuned version for Volterra networking data analytics platform.