Interactive chart builder for in-depth data observing in time.
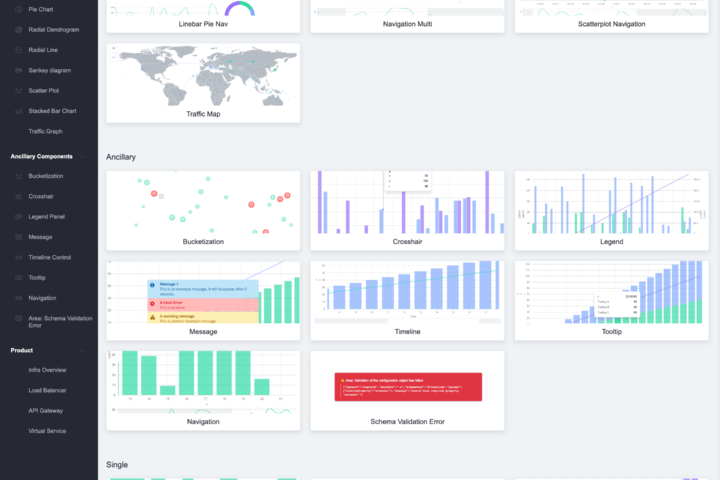
Uses my PlusJS – Charts Library under the hood.
Live Demo
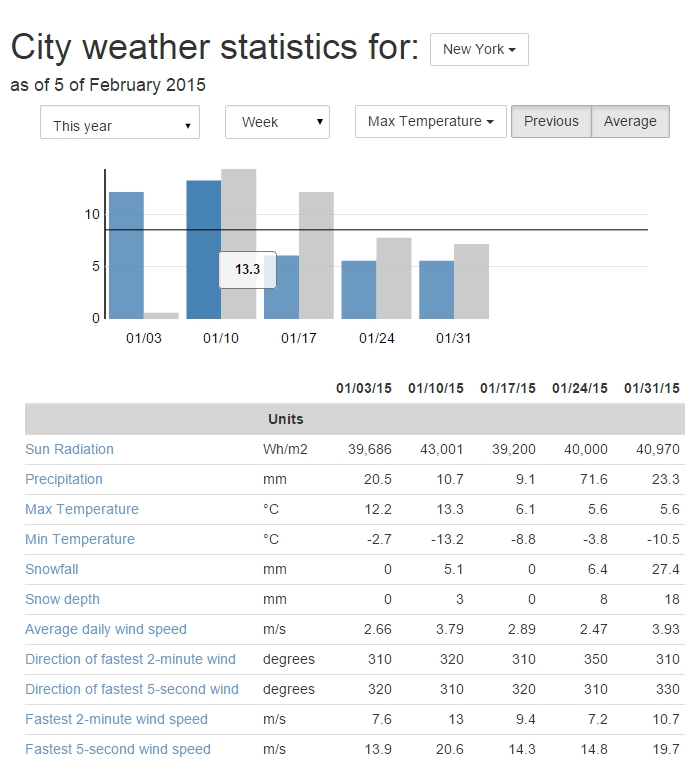
This demo utilizes climate data from National Climatic Data Center – NOAA as of 5th of february 2015
But it may definitely be any multi-parameter data. Like daily business reports on costs, expenditures, payments, etc
This demo application has multiple parameters to select. Dropdowns from left to right:
- period of observation: “This year”, “This month”, “This week”, “All time” – starting from 1st of January 2014, or even select custom interval
- time interval to plot as an aggregated value (single bar)
- city selector (only three cities with pretty much different weather are available: San Francisco, New York, Minneapolis)
- climate parameter
Average button shows the average value line for selected period.
And previous button enables second grey bar before the blue one to show the previous value for the same period. For example: if you select “month” period and “day” interval – grey bars would stand for the same day in the previous month.
Each bar is clickable to drill down the data for the shorter time interval.
Hover over the bar to see exact value on the popup label.
Table is provided for exact value reference
If you need custom interactive temporal analysis application – send us an inquiry