We are glad to introduce you technology for managing connected data.
Live Demo
Previous year we made GraphiTabs – an extension for Chrome browser to manage many tabs. Now this technology is available to you for any type of data. Contacts for inquiry.
How Does it Work?
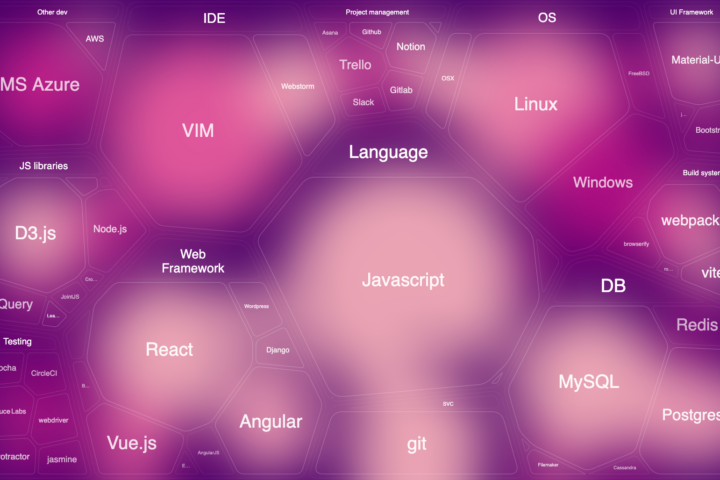
Graphiy Tree Editor is a toolkit for data manipulation. It is a general purpose user interface for editing hierarchical data structures like trees. It may be used as data visualizer for analysis and as graphic management tool for editing.
It is a standalone browser application which can be run against any server API with hierarchically connected data. It can handle from few nodes up to 100k+ and is capable to be enhanced tenfold.
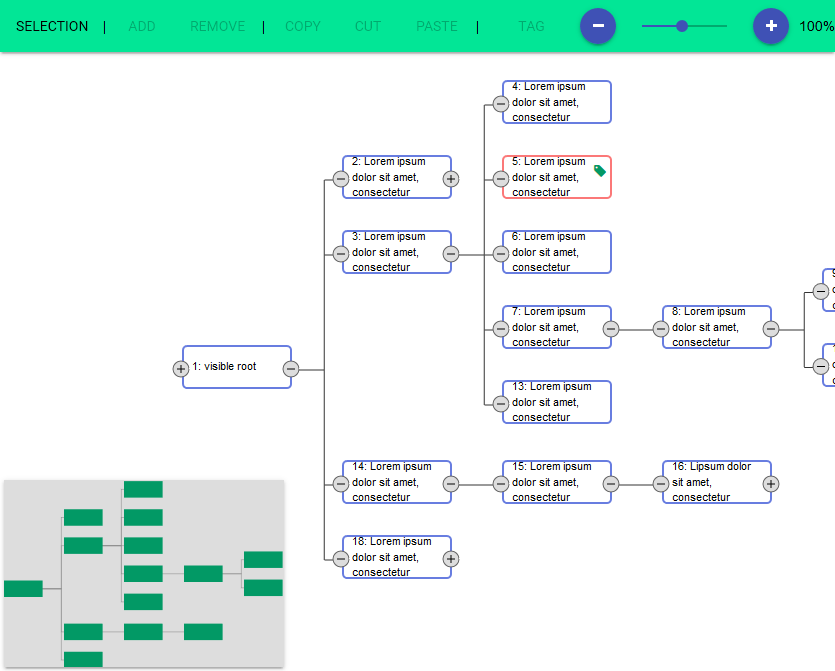
The functionality covers basic actions on nodes:
- Create
- Update
- Copy/Cut/Paste
- Delete
some advanced features like:
- selection one by one or rectangular selection in batch;
- different node types
as well as intuitive navigation with:
- Zoom
- Pan
- and Bird view of all loaded data
Hierarchical structure manipulation is facilitated with:
- node’s children collapse expand
- and even parent collapse/expand
Editing capabilities include:
- inline item’s content editing
- panel for editing long content (bigger the node can fit)
- tagging
Pretty flexible Customization is put inside the technology. So, many properties are easily adjustable:
- node form, size, border type
- color scheme
- layout (vertical, horizontal, radial, etc)
- controls look and feel
Basically it may fit your own design.
In this example controls are implemented with Google Material Design
And what’s most powerful – this technology is modular. That means it may be extended with many techniques like Hierarchy Layout
Please, contacts us for inquiry.