Volterra.io, now acquired by F5 Networks, S&P 500 member is a platform for distributed cloud services, where user can deploy, connect and operate applications.
This involves a lot of network monitoring tools.
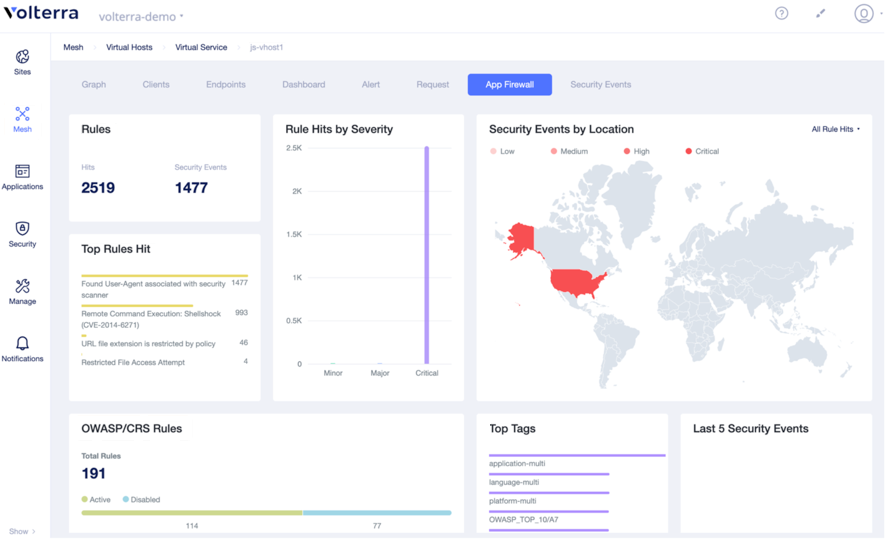
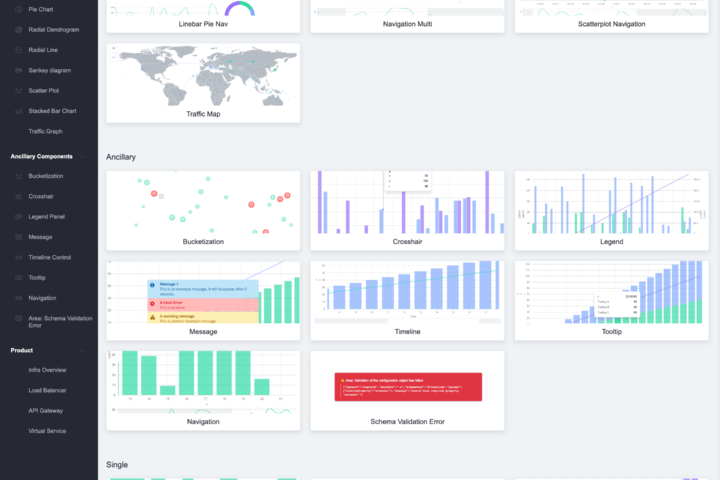
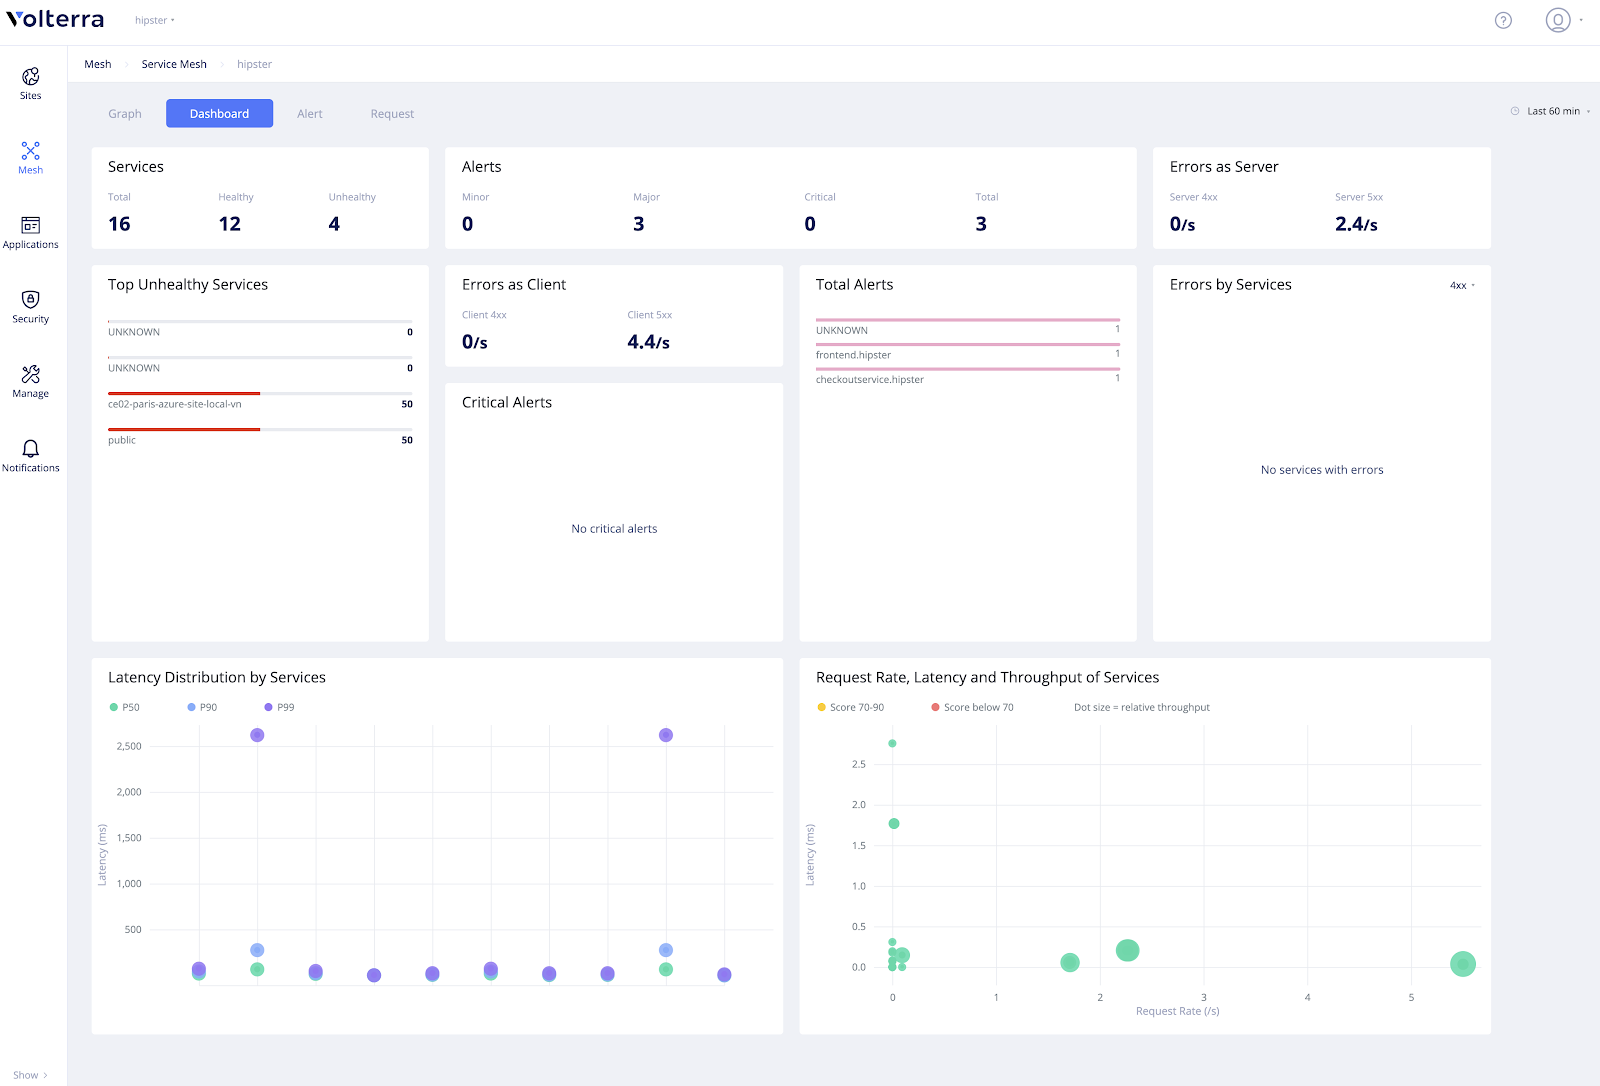
As the lead developer for the frontend portion of this project, I worked on application development, namely: creating a dashboard with admin-configurable widget templates for users to generate widgets from. Since frontend development began concurrently with backend development, no live data was available at the time. As a result, I developed a mock server and API, which I later integrated with the live ecosystem of cloud services. The charts and graphs within the application use Charts library v2, a project I had previously completed.
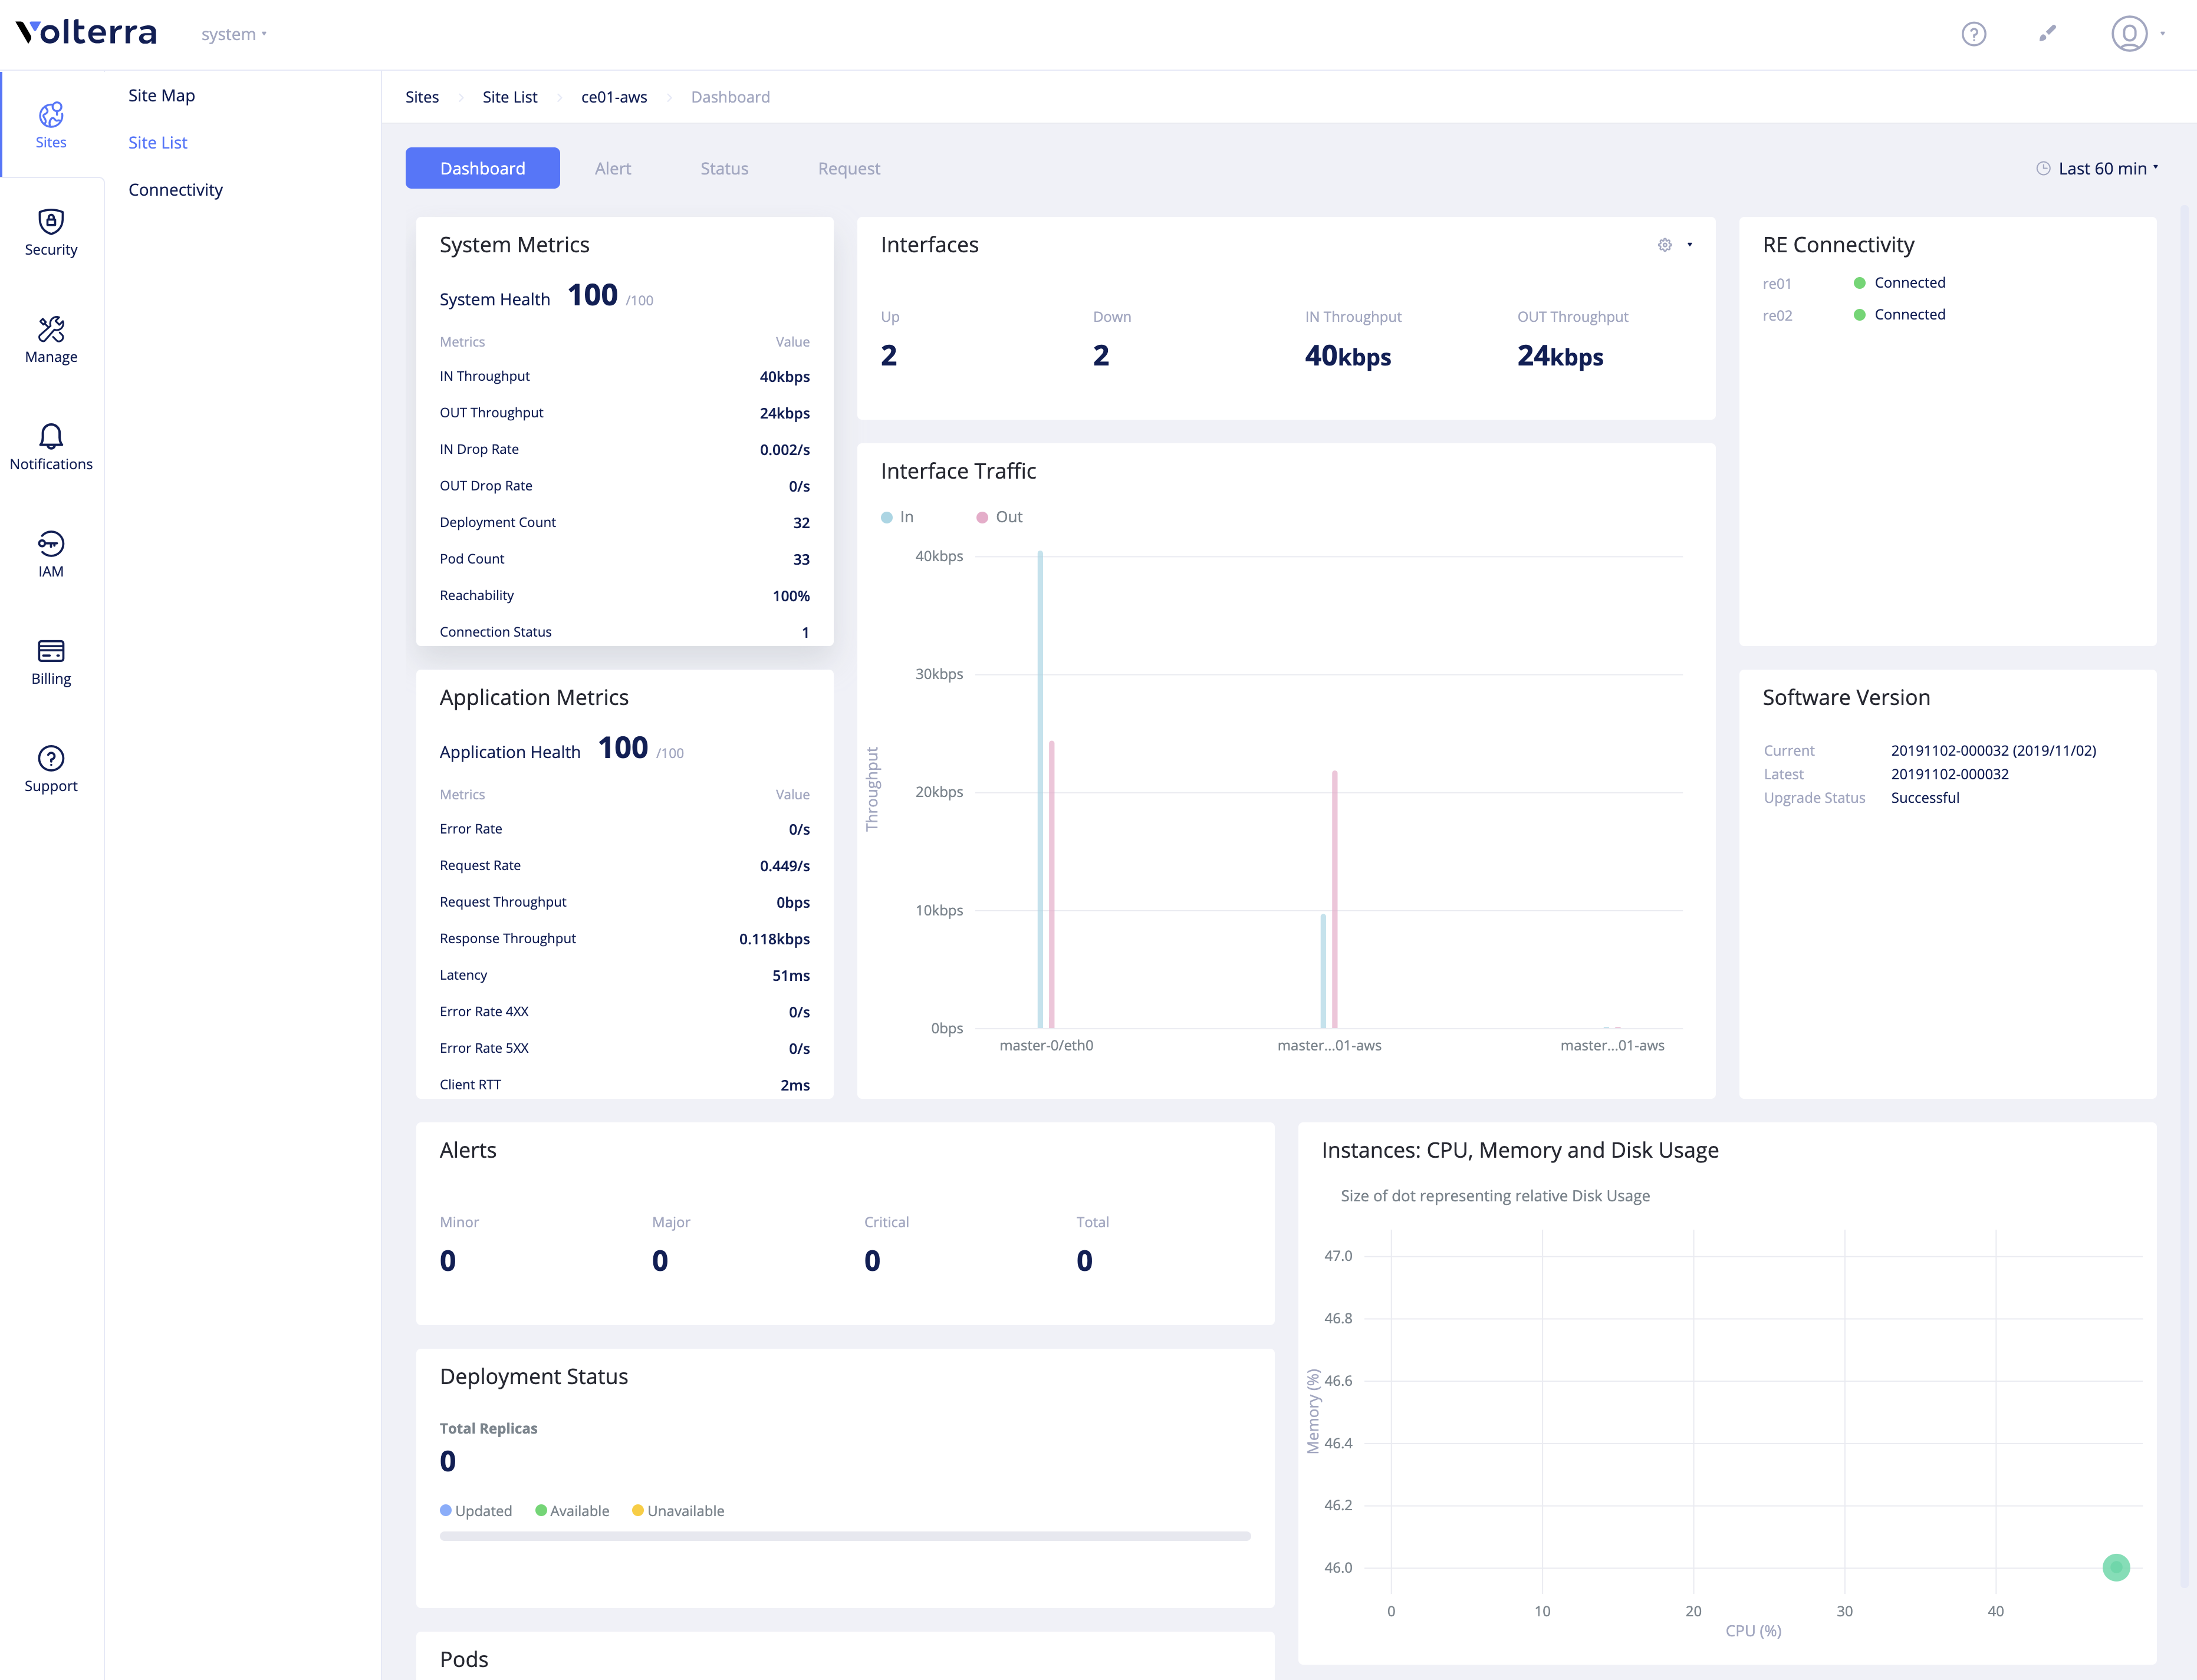
In a global Software Defined Network solutions there are tons of different dashboards, but widgets as building blocks allow to manage that complexity with ease.